Dividend Tracker for Vanguard
Track your Vanguard dividends and mutual fund distributions in one dashboard. Connect your Vanguard brokerage, IRA, or Roth IRA through Plaid (401(k) and 529 coverage varies by plan — check the picker) — MerryDiv imports your VYM, VIG, VOO, VXUS, VTI dividends alongside your individual stock positions. Free to get started.
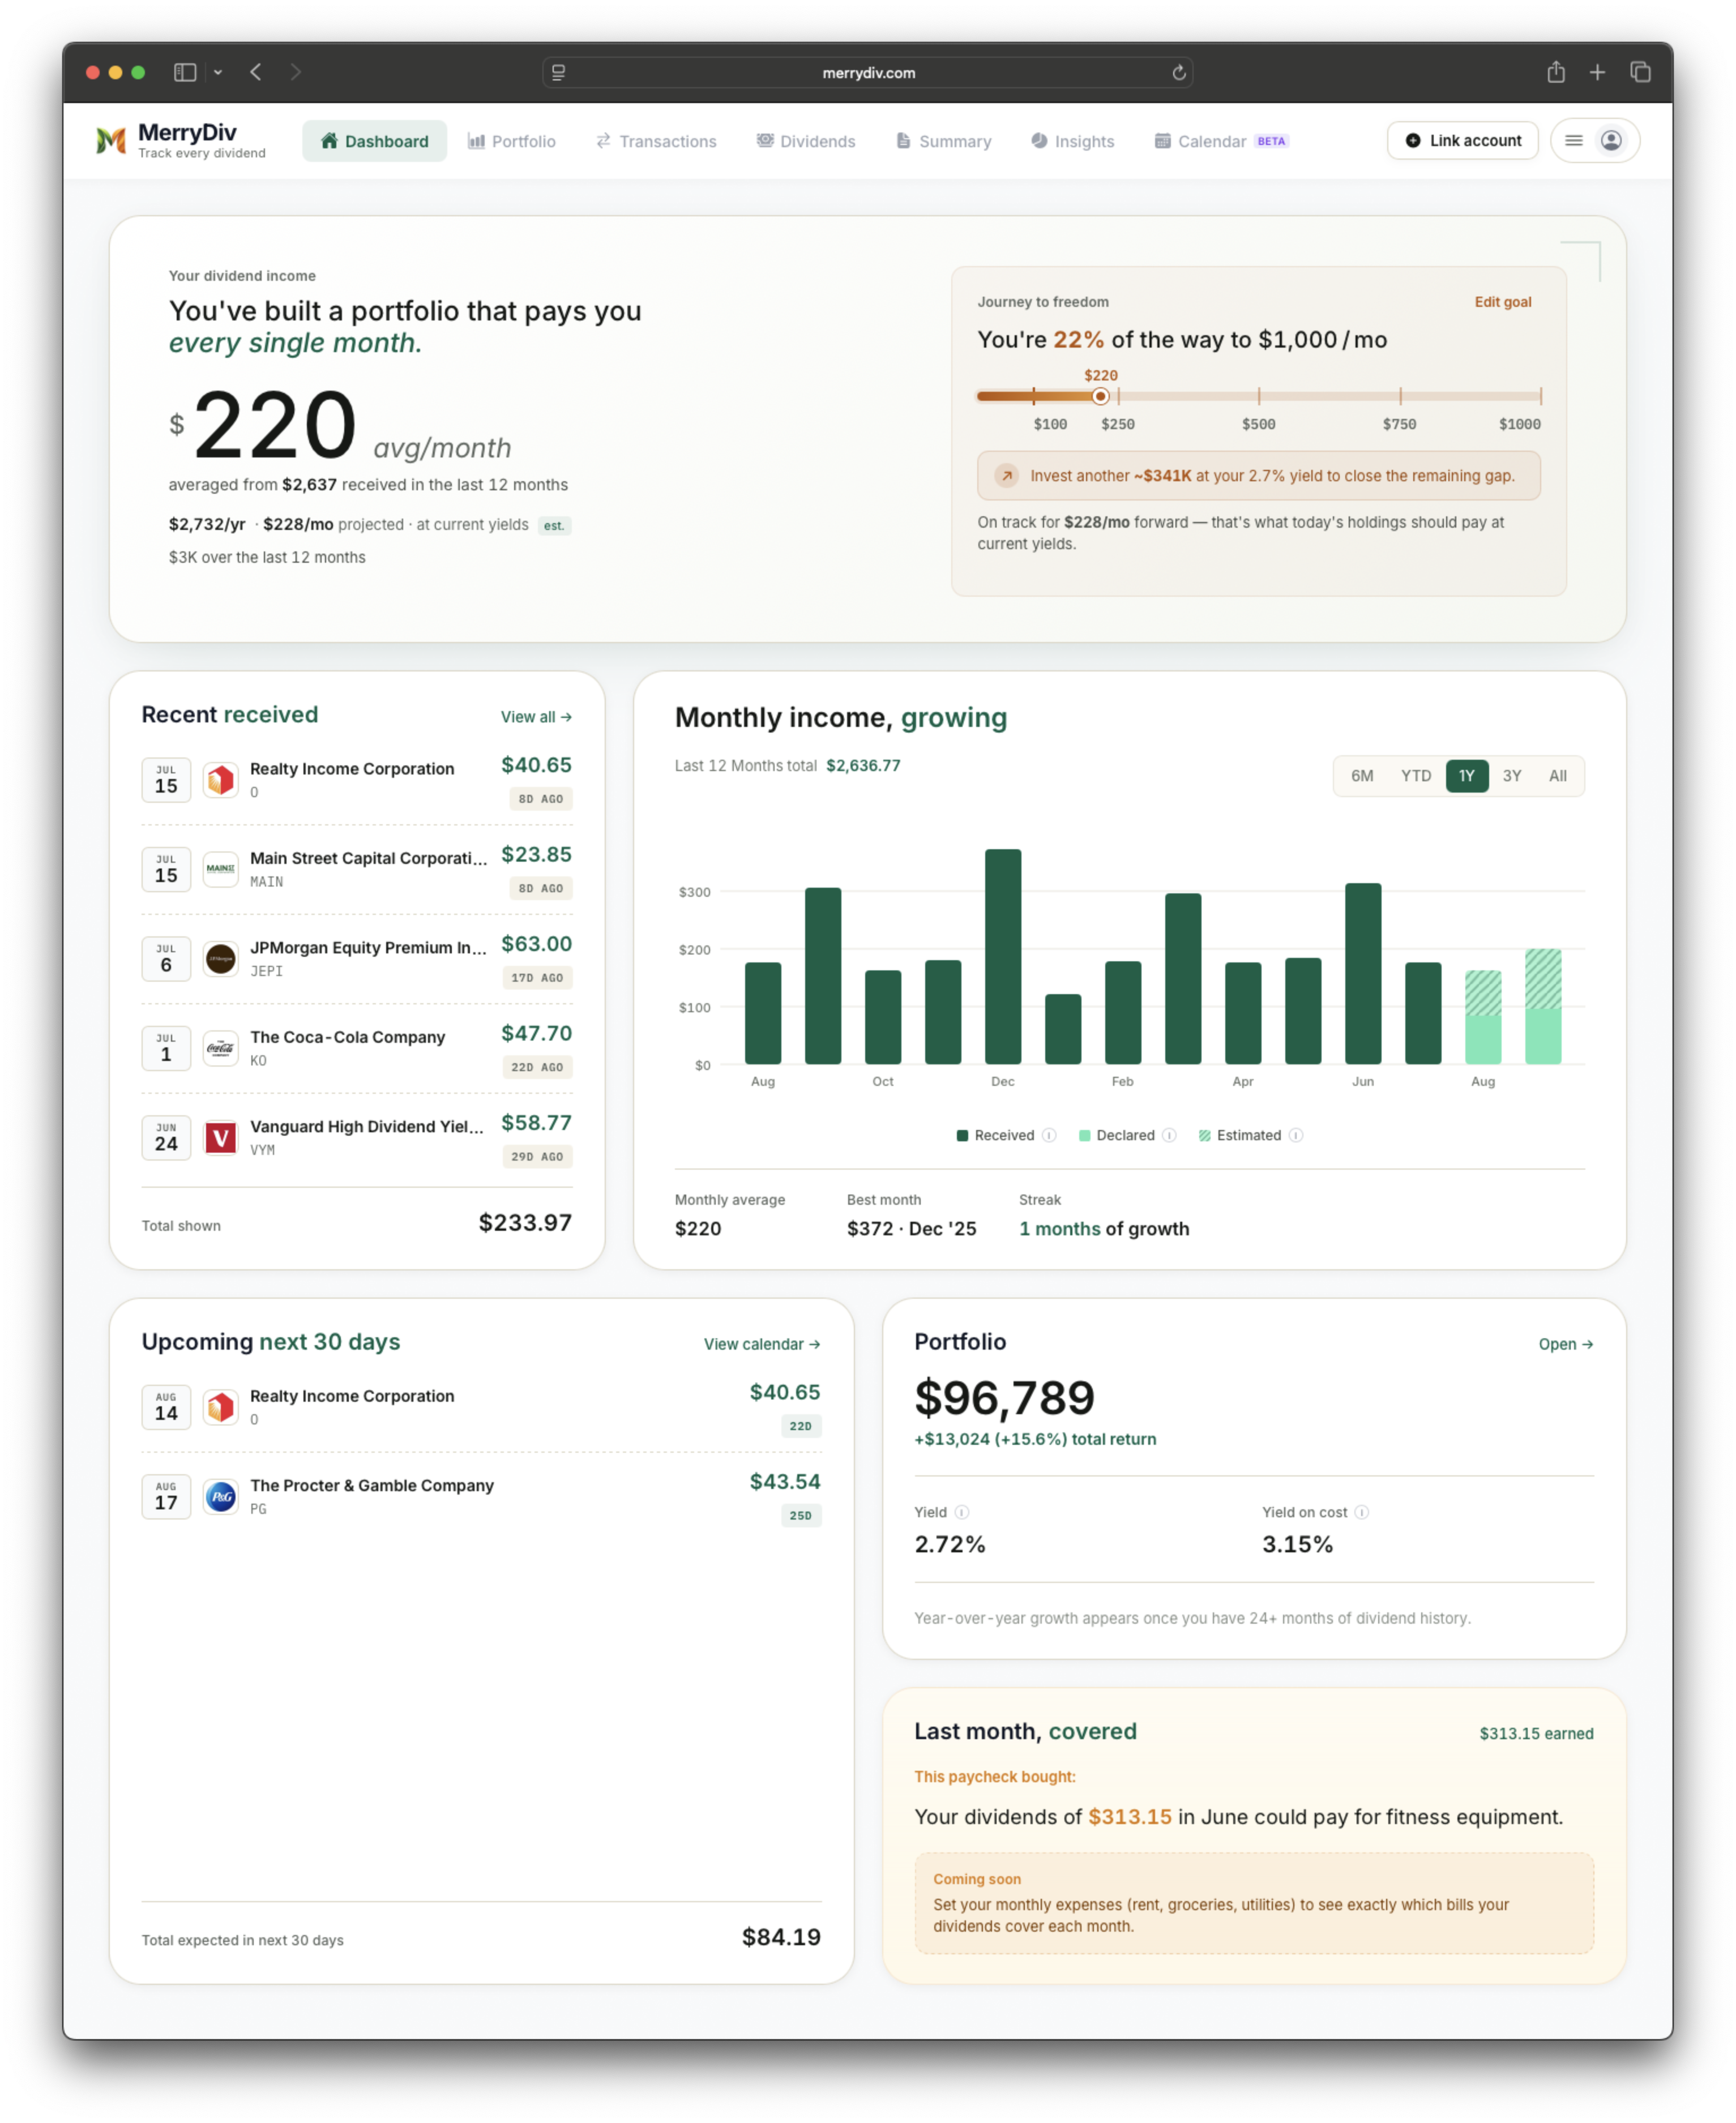
MerryDiv dashboard — Vanguard mutual-fund and ETF distributions consolidated across every account.
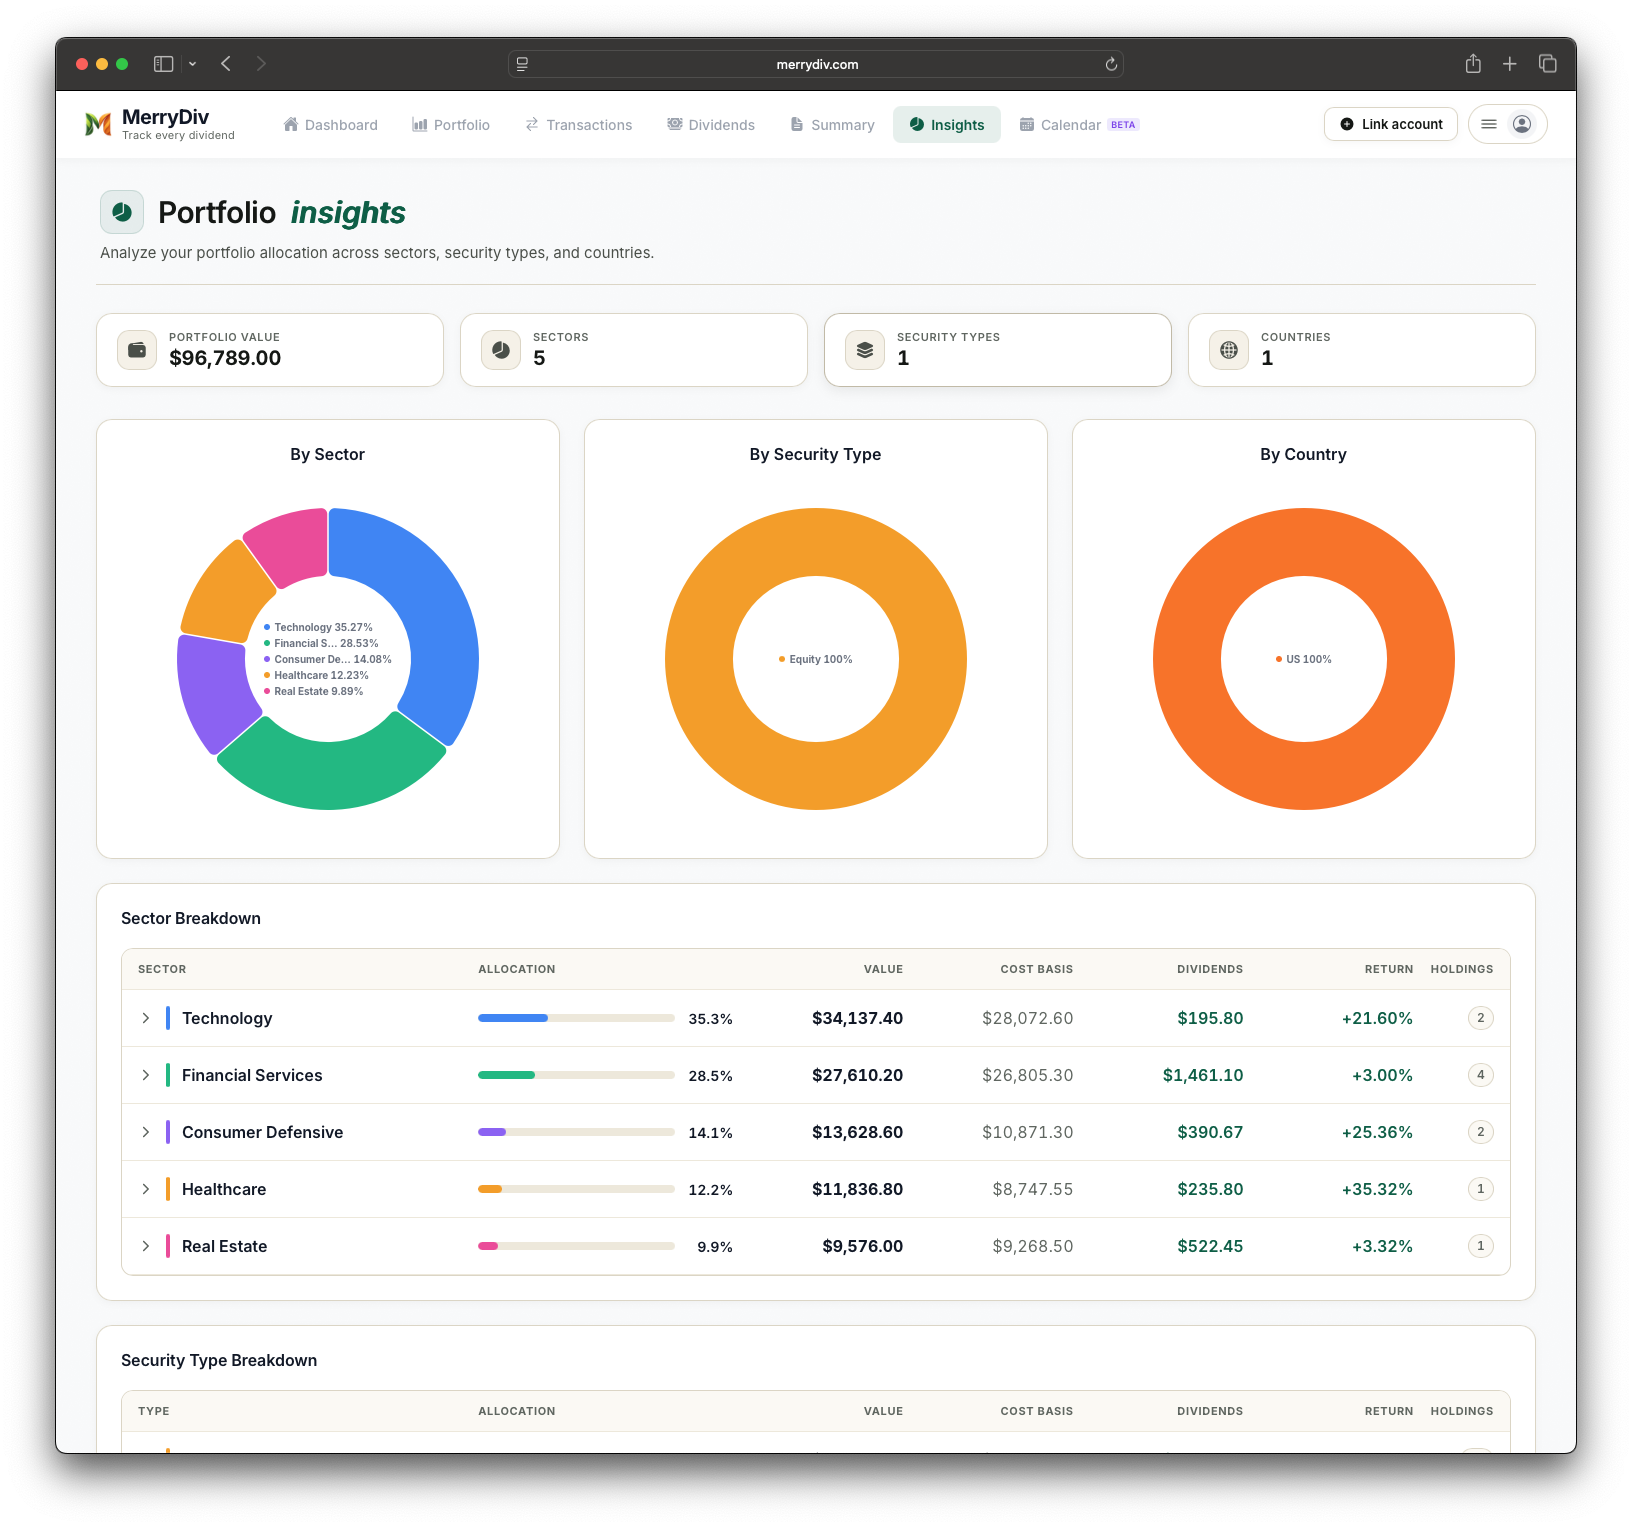
Insights — see the underlying sector and country breakdown behind your Vanguard ETFs.
What MerryDiv syncs
- Dividend payments from your Vanguard brokerage, IRA, and Roth IRA — imported automatically through Plaid; 401(k) and 529 covered where Vanguard exposes them
- Full support for Vanguard's dividend ETFs: VYM, VYMI, VIG, VIGI, VNQ, VPL
- Vanguard's largest index funds: VTSAX/VTI, VFIAX/VOO, VTIAX/VXUS, VBTLX/BND
- Admiral Shares mutual fund conversions — pre- and post-conversion tickers appear as separate securities in your feed (matching how Plaid returns them); both dividend streams remain in your history
- Fractional dollar-based purchases via Vanguard's fractional shares program
Common account types you can track
MerryDiv works with any account your broker exposes through Plaid Link — the picker at connection time shows exactly what's available for your login. Anything Plaid doesn't cover can be added as a manual portfolio.
Vanguard-specific notes
Vanguard's Plaid connection has become considerably more reliable after several years of on-and-off support — brokerage, IRA, and Roth accounts typically sync well. 401(k) and 529 coverage varies by plan; check the Plaid picker to confirm yours is available. Two Vanguard-specific things to know:
- ETF vs. mutual-fund duplicates. Vanguard's index products often ship as both an ETF and a mutual fund (VTI + VTSAX, VOO + VFIAX). They pay the same underlying dividend but at different frequencies (ETFs quarterly, mutual funds quarterly with year-end estimated distributions). MerryDiv treats them as separate holdings so your history reflects what actually happened.
- Admiral Shares conversion. When Investor Shares (like VBIAX) convert to Admiral Shares, the ticker changes and Plaid reports the old and new tickers as distinct securities. MerryDiv shows both in your dividend history — nothing is lost, though the timeline appears under two ticker rows rather than one merged line.
- Year-end estimated distributions. Vanguard mutual funds distribute a portion of realized capital gains at year-end. Those show as separate line items in MerryDiv, tagged so they don't distort your dividend-yield calculation.
Popular Vanguard dividend holdings
Yield, frequency, and annual dividend for each. Click any row for full history and analysis.
Yields shown are snapshot values as of July 2026. Live figures on the stock page for each ticker. Educational examples only — not investment advice or a recommendation to buy any specific security.
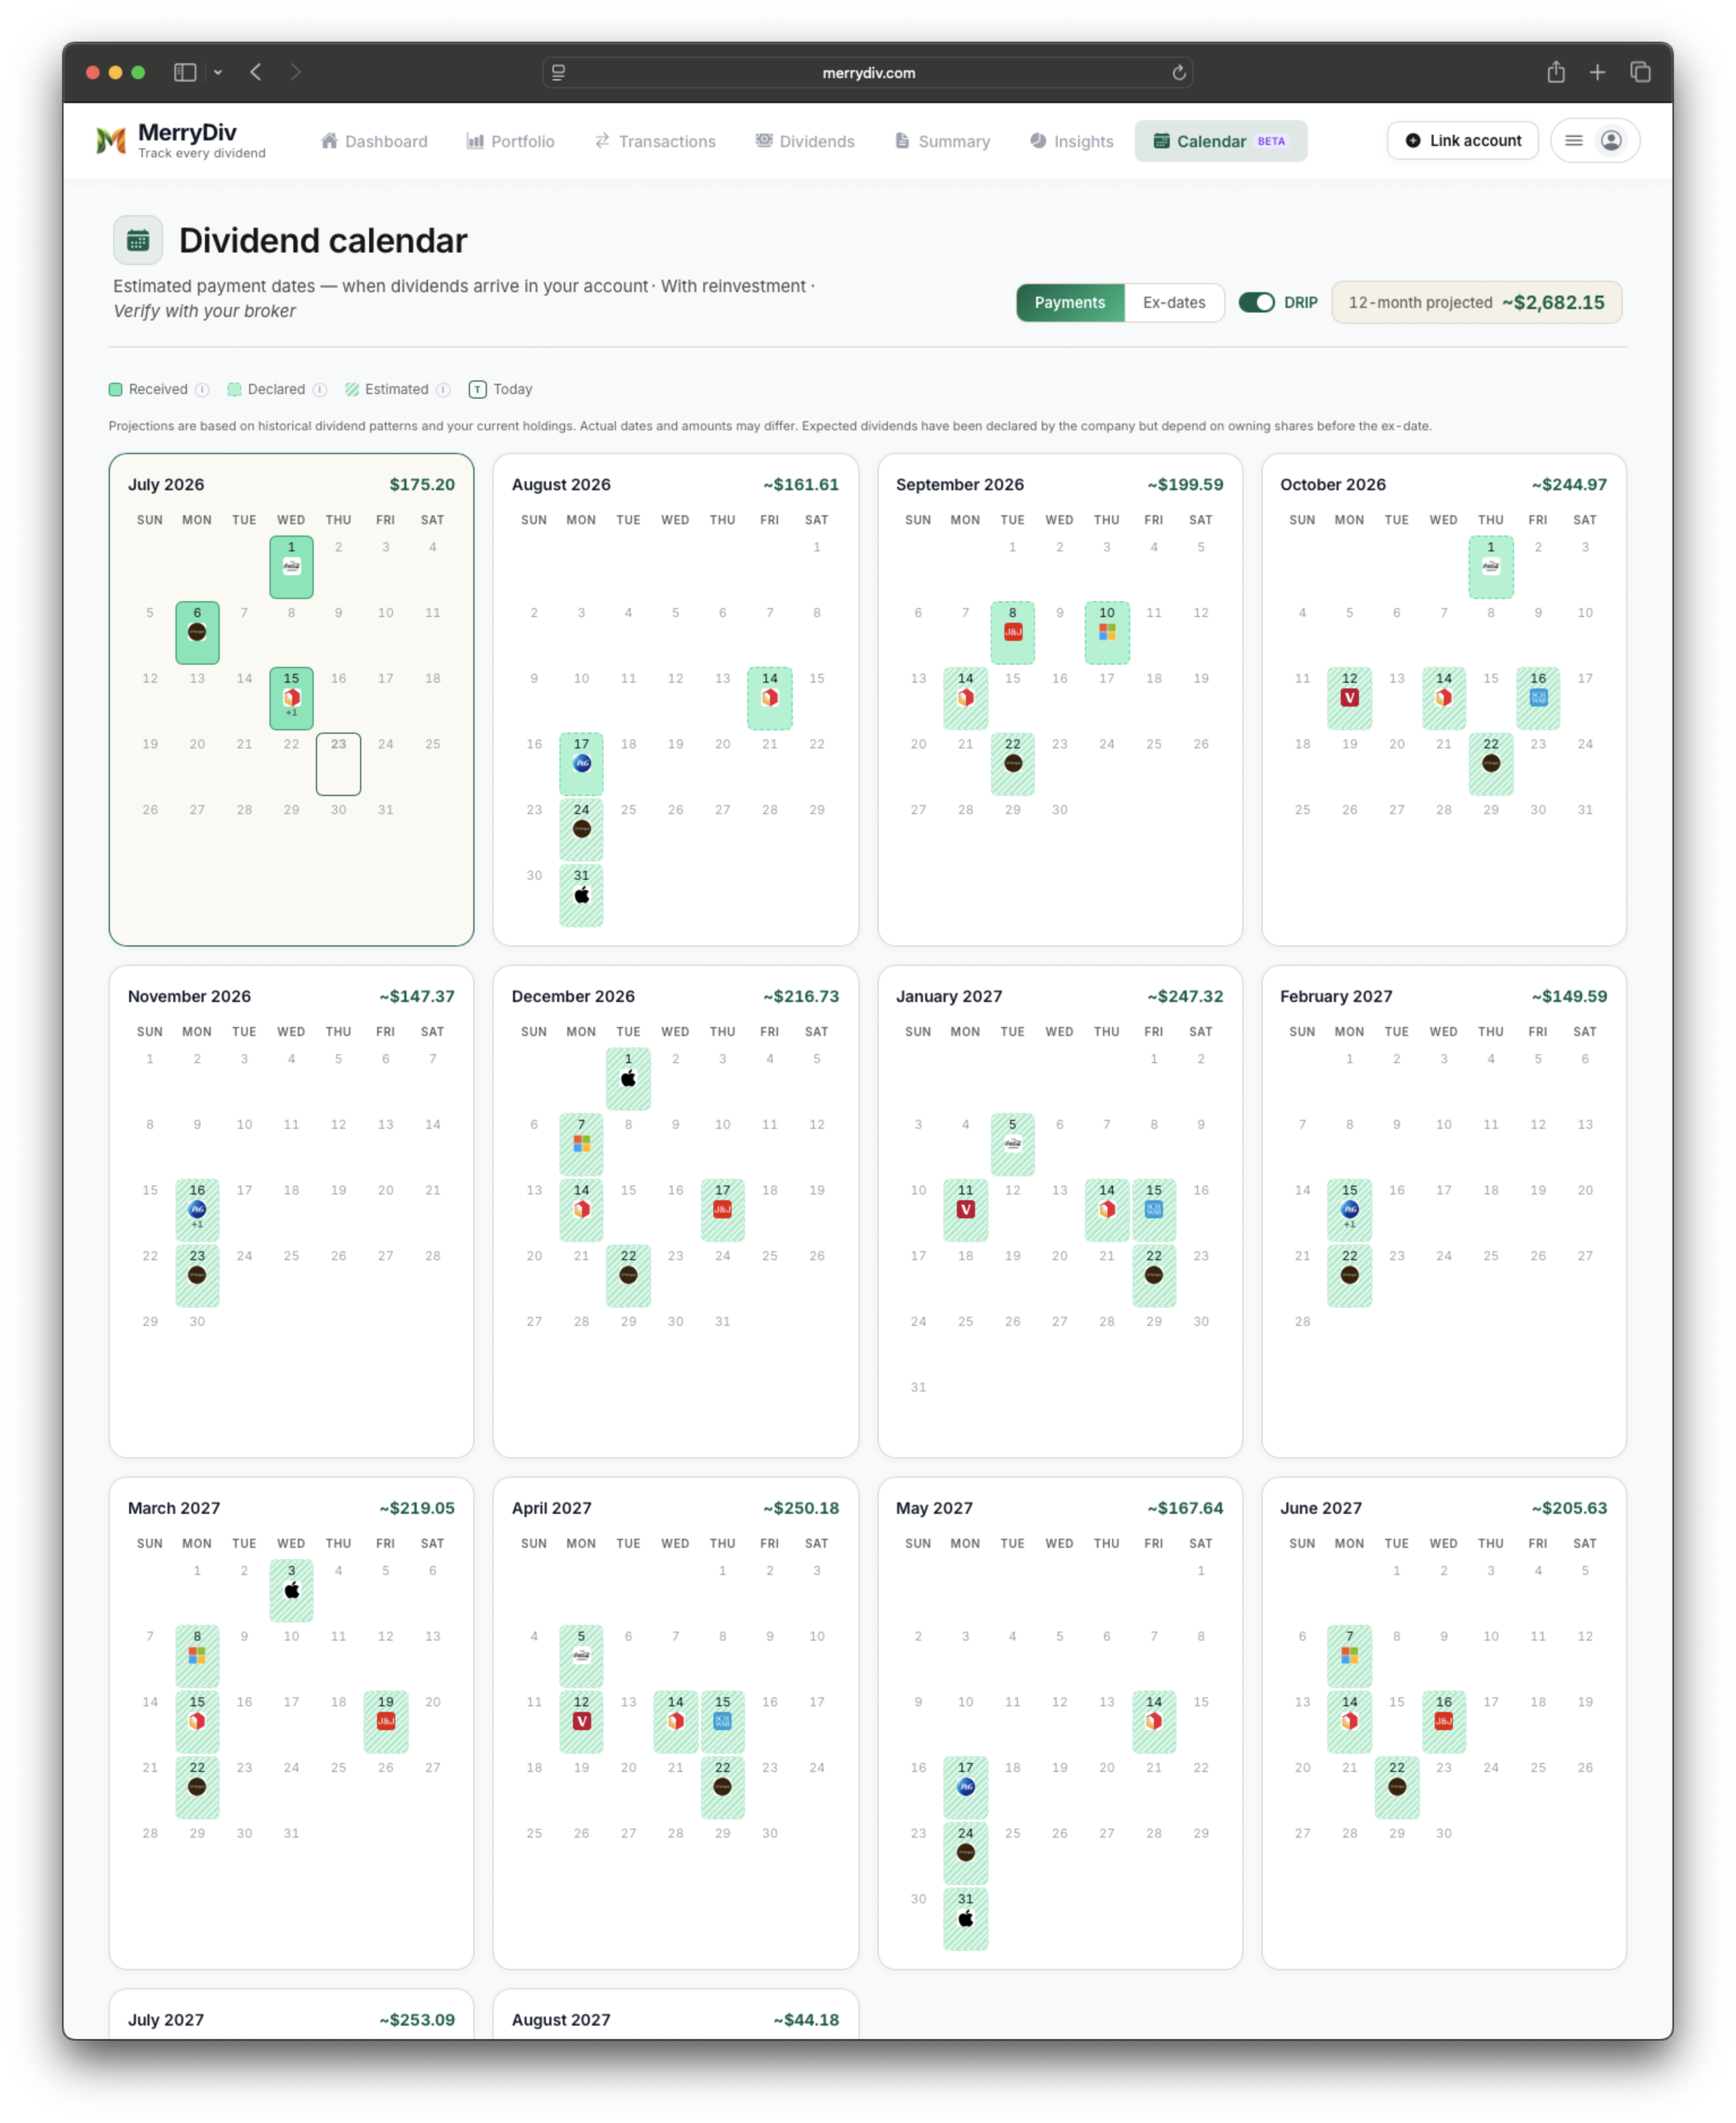
Dividend calendar — VYM, VIG, VOO, and every Vanguard fund payment across the year.
Vanguard's dividend reporting — the good and the missing
Vanguard's platform is legendary for low costs and low frills. The "low frills" part extends to dividend tracking: the account dashboard shows dividend distributions as they hit, but there's no built-in projection view, no per-holding growth history, and no combined-account rollup. Vanguard's design philosophy assumes you'll re-invest and forget — which is fine if you're 30 years from retirement, less fine if you're actually trying to plan around dividend income.
The three practical gaps for Vanguard investors specifically:
- Mutual fund vs. ETF share class parallel-tracking. Vanguard's hallmark quirk: many index products exist as both a mutual fund (VTSAX) and an ETF (VTI) that follow the same underlying. If you converted from one to the other (Vanguard now allows free conversions), your dividend history splits across two tickers on the Vanguard side. MerryDiv treats them as separate positions but you can see the combined income easily.
- Year-end capital gains distributions. Vanguard's mutual funds distribute realized capital gains alongside their regular quarterly income, typically in December. Those cap-gains distributions inflate any dividend-based yield calculation if you count them as dividends. MerryDiv tags them separately so your yield-on-cost math doesn't get distorted by non-recurring cap-gains payouts.
- Cross-account rollup. If you hold VTI in your Vanguard brokerage AND VTI in your employer's 401(k) at Vanguard, the account overview shows them separately. Same holding, two lines. MerryDiv shows combined position size and combined income while preserving per-account cost basis.
Investor Shares to Admiral Shares — what happens to your history
Vanguard automatically converts Investor Shares to Admiral Shares once you meet the minimum ($3,000 for most funds). The conversion is tax-free and doesn't reset cost basis, but the ticker changes (VFINX → VFIAX for the 500 Index Fund, for example). Because Plaid reports the old and new tickers as distinct securities, MerryDiv shows both in your dividend history — the pre-conversion payments stay under the old ticker and the post-conversion payments continue under the new one, so nothing is lost, just filed under two rows instead of one.
VYM vs. VIG vs. VOO — how the different Vanguard dividend ETFs compare
Vanguard offers three broadly-used dividend-adjacent ETFs, and they solve different problems. VYM (High Dividend Yield) targets the top ~50% of dividend payers by yield — ~2.7% current yield. VIG (Dividend Appreciation) targets stocks with 10+ years of dividend increases — lower starting yield (~1.7%) but faster dividend growth. VOO (S&P 500) is a broad index with a small ~1.2% dividend yield, useful as a "core" holding with dividend income as a byproduct rather than the goal. Many dividend portfolios use some combination of the three.
Vanguard account view vs. MerryDiv
Vanguard's dividend reporting is minimal by design. Here's what a dedicated tracker adds.
| Feature | Vanguard account view | MerryDiv |
|---|---|---|
| Historical dividend list | ✓ | ✓ |
| Forward income projection | ✗ | ✓ |
| Cross-account rollup (Brokerage + IRA + 401(k)) | ✗ | ✓ |
| Year-end cap-gains vs. dividend separation | In 1099-DIV only | In dividend feed |
| Yield on cost | ✗ | ✓ |
| Upcoming ex-dividend + payment calendar | ✗ | ✓ |
| Investor → Admiral share class history preserved | ✓ | yes (as two ticker rows) |
| Per-position dividend growth history | ✗ | ✓ |
| Multi-broker consolidation | ✗ | ✓ |
| Export to CSV | ✓ | ✓ |
How to connect Vanguard in MerryDiv
- 1Create a free MerryDiv accountEmail + password only — no credit card required.
- 2Click Connect BrokerageThe Plaid picker opens with 10,000+ US and Canadian institutions searchable by name or logo.
- 3Select Vanguard and sign inYou authenticate on Vanguard's page through Plaid. Your credentials never touch MerryDiv.
- 4Choose which accounts to importBrokerage, IRA, and Roth IRA sync through the same connector. 401(k) and 529 coverage varies by plan — check the Plaid picker to confirm yours is available.
- 5Dividends start syncing automaticallyHistorical distributions import within minutes (Investor and Admiral tickers appear as separate rows since Plaid reports them as distinct securities); future dividends land within 24 hours.
Vanguard dividend ETFs: VYM vs. VIG vs. VOO
Vanguard's dividend ETF family solves three different problems — current yield, long-term dividend growth, or broad market exposure with dividends as a byproduct. Five ETFs frequently discussed in dividend-investing communities:
| ETF | Yield | Payout | Category |
|---|---|---|---|
| VYM | 2.68% | Quarterly | Broad high-dividend-yield exposure (yield-weighted) |
| VIG | 1.72% | Quarterly | Long-term dividend-appreciation screen (10+ years of increases) |
| VOO | 1.24% | Quarterly | S&P 500 index ETF (broad-market, dividends as a byproduct) |
| VTI | 1.20% | Quarterly | Total-market ETF (broad diversification, not a dividend-specific screen) |
| VNQ | 4.02% | Quarterly | Real-estate ETF — rate-sensitive; distributions include return of capital and non-qualified dividends |
Yields as of July 2026 and change frequently. This list reflects funds commonly discussed in dividend-investing communities, not MerryDiv user data. Educational examples only — not investment advice or a recommendation to buy any specific security.
How to track VYM dividends
VYM pays a quarterly dividend that's grown at roughly 6% annualized over the past decade. Vanguard shows the payment when it arrives; MerryDiv shows the full history plus the forward-projected annual income based on the current declared dividend rate. If you hold VYM as a core dividend position, MerryDiv's per-position yield-on-cost is where the compounding thesis actually becomes visible.
Tracking VTSAX vs. VTI dividend income
VTSAX (mutual fund) and VTI (ETF) track the same underlying index but distribute differently: VTI's dividend hits on a fixed quarterly schedule; VTSAX distributes quarterly income plus a year-end capital gains estimate. For dividend tracking purposes, VTI's timeline is cleaner and easier to forecast. If you convert VTSAX to VTI (Vanguard now allows it free of charge), MerryDiv preserves the pre-conversion transaction history.
Does Vanguard have a dividend calendar?
Vanguard doesn't publish a forward dividend calendar the way SEC EDGAR or your Plaid feed does — the platform relies on you looking up each fund's declaration history individually. MerryDiv's Dividend Calendar aggregates ex-dividend and payment dates across every Vanguard fund and every individual stock you hold, so you see the full month at a glance rather than checking each holding manually.
Vanguard dividend reinvestment — how DRIP works
For eligible securities, Vanguard offers dividend reinvestment (DRIP) — enrollment defaults and per-position controls depend on the fund type and your account settings. When a distribution reinvests, Vanguard purchases fractional shares at the reinvestment price. When Plaid exposes both the dividend and the reinvestment purchase, both land in your MerryDiv transaction feed — the dividend counts toward your dividend income totals and the reinvestment purchase updates share count and cost basis for downstream yield-on-cost math. The two rows aren't visually merged into a single "reinvested at $X.XX" line, but nothing is lost.
Frequently asked questions
Track your dividends free
Connect once, see your dividend payments across your connected accounts in one dashboard. Free plan, no credit card required.
Get started for free